From Bell Curves to Syllogisms: How Quantitative Logic Shapes Academic Arguments
For decades, higher education has maintained an invisible, artificial wall between the quantitative and qualitative disciplines. STEM students isolate themselves within datasets, standard deviations, and continuous probability functions, while humanities scholars immerse themselves in rhetoric, dialectics, and historical interpretation. This academic tribalism implies that numbers and words operate on entirely different planes of truth.
However, at the highest levels of collegiate research, this division breaks down completely. The structural anatomy of a persuasive undergraduate or postgraduate thesis relies on a unified foundation: formal logic. Whether a researcher is graphing a data distribution curve or deconstructing an ethical dilemma, the path to a bulletproof conclusion requires mapping raw premises to verifiable outcomes without cognitive leaps.
By analyzing the mechanics of the normal distribution alongside the classical deductive frameworks of Aristotelian syllogisms, we can uncover how quantitative logic systematically shapes, strengthens, and elevates modern academic writing.
The Mathematical Framework: Normal Distributions in Rhetoric
In empirical research, raw data is inherently chaotic until it is organized through a mathematical model. The most vital of these models is the Gaussian distribution, commonly known as the bell curve. Mathematically, a continuous random variable X follows a normal distribution when its probability density function adheres to the standard formula:
f(x) = \frac{1}{\sigma\sqrt{2\pi}} e^{-\frac{1}{2}\left(\frac{x-\mu}{\sigma}\right)^2}
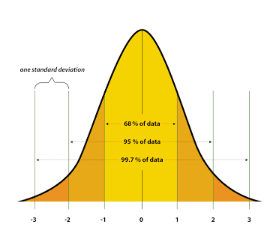
In this formula, \mu represents the population mean, while \sigma denotes the standard deviation. When plotted, this equation produces a symmetrical curve where the highest concentration of data points cluster around the central mean, tapering off cleanly toward positive and negative infinity.
When compiling complex empirical research projects, managing these data boundaries requires precise structural frameworks. Undergraduates often find that navigating the transition from raw statistical calculations to persuasive narrative prose presents a significant academic hurdle. To overcome this obstacle, many successful writers rely on specialized essay writing help to ensure their quantitative data integrates smoothly with qualitative analysis. Grounding an empirical research paper in rigorous statistical frameworks prevents arbitrary claims, allowing researchers to draw objective conclusions from verified data clusters.
Translating the Bell Curve into Logical Arguments
The structural value of a bell curve extends far beyond simple statistical calculations; it serves as a powerful conceptual model for organizing academic claims. In a standard distribution, data points falling within one standard deviation (\pm1\sigma) account for roughly 68.2\% of the population, establishing the empirical baseline or “the norm.” Points stretching to the second standard deviation (\pm2\sigma) capture 95.4\%, while those reaching the third (\pm3\sigma) encompass 99.7\% of all observable phenomena.
Good academic writing mirrors this mathematical distribution by organizing arguments into specific analytical zones:
- The Baseline Mean (\mu): This represents the established consensus or current state of scholarship within your field. Every persuasive paper must clearly define this starting point.
- The Variance (\sigma): This represents the contextual nuances, varying data points, and counterarguments that expand upon the baseline.
- The Outliers (\pm3\sigma): These are the anomalous findings or radical alternative theories that test the limits of your primary hypothesis.
By viewing an essay through this quantitative lens, a writer can avoid the common trap of overemphasizing anomaly data over generalized trends, or vice versa. A structurally sound research paper dedicates its core real estate to the high-probability clusters found within \pm1\sigma and \pm2\sigma, while using the rare anomalies located at the margins to refine the scope of the thesis.
The Humanities Mirror: Classical Syllogisms and Deductive Rigor
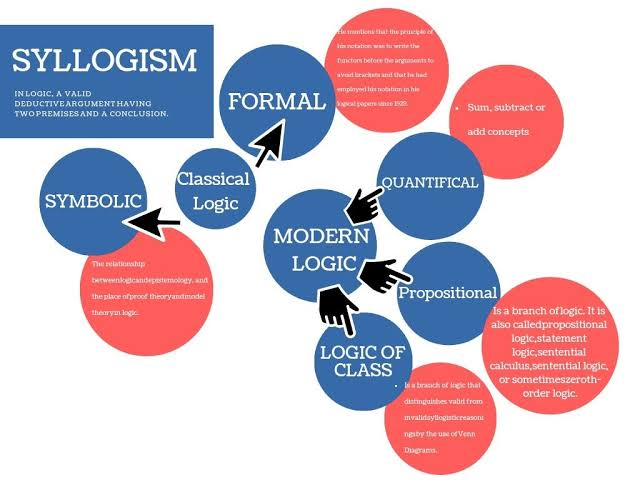
When transitioning from empirical science to the humanities, the mathematical bell curve transforms into the deductive syllogism. Formulated by Aristotle, the classic syllogism is a three-part deductive framework consisting of a major premise, a minor premise, and an inescapable conclusion.
[Major Premise]: All humans are mortal.
[Minor Premise]: Socrates is human.
[Conclusion]: Therefore, Socrates is mortal.
In formal symbolic logic, this conditional relationship is written as:
(P \rightarrow Q) \land (R \rightarrow P) \vdash (R \rightarrow Q)
This equation states that if P implies Q, and R implies P, it must logically follow that R implies Q. If both premises are true and the structure contains no logical fallacies, the conclusion is absolutely certain.
For students writing complex papers in political theory, ethics, or metaphysics, maintaining this deductive validity across a twenty-page assignment is incredibly challenging. Because an unvetted premise can undermine an entire semester’s research, seeking professional philosophy paper help can be an invaluable strategy for testing the strength of your arguments. Utilizing an external review process helps writers pinpoint hidden assumptions, circular reasoning, and gaps in deductive logic before submitting their final drafts. Far from being exclusive to STEM, this structured approach ensures that humanities papers achieve the same level of logical certainty found in a mathematics laboratory.
The Interdisciplinary Synthesis: Data Meets Discourse
The highest-scoring academic assignments do not choose between mathematical precision and rhetorical style; they combine both. When a research paper synthesizes empirical data with deductive clarity, it creates an authoritative argument that is exceptionally difficult to pick apart.
Consider the following interdisciplinary comparison table, which illustrates how quantitative metrics map directly onto qualitative structural elements:
| Quantitative Concept (STEM) | Qualitative Equivalence (Humanities) | Primary Academic Function |
| Population Mean (\mu) | Literature Review / Established Consensus | Defining the current boundaries of academic knowledge. |
| Standard Deviation (\sigma) | Nuance, Qualification, and Counterargument | Setting parameters and addressing conflicting viewpoints. |
| Statistical Outliers (\pm3\sigma) | Anomalies, Extreme Cases, and Paradoxes | Testing the limits and validity of the primary hypothesis. |
| Statistical Significance (p < 0.05) | Textual / Empirical Evidence Verification | Confirming that structural claims are backed by solid proof. |
| Deductive Axiom | Major Premise of an Argument | Establishing foundational assumptions that require no further proof. |
By utilizing this structural synthesis, a researcher can avoid the common flaws that weaken undergraduate submissions. A STEM paper that lacks deductive structure becomes a meaningless collection of raw metrics without a clear narrative. Conversely, a humanities essay that lacks empirical boundaries often dissolves into vague, speculative opinions.
Key Takeaways
- Logic Bridges the Academic Divide: Both statistical analysis and long-form essay writing depend on the same foundational rules of formal logic and structured arguments.
- The Bell Curve Offers a Structural Blueprint: Organizing a paper’s claims around a central consensus while carefully analyzing variations helps maintain a balanced, objective thesis.
- Syllogisms Provide Bulletproof Organization: Ensuring your arguments follow a clear, deductive path from major premise to minor premise prevents logical fallacies.
- Technical Precision Drives Academic Success: Integrating data visualization, mathematical notation, and precise definitions significantly elevates the authority of your writing.
Frequently Asked Questions
1. How can I apply the concept of a normal distribution to a purely qualitative essay?
You can use the normal distribution as a structural guide for your literature review and body paragraphs. Your main analysis should focus on the academic consensus (the mean) and the primary competing viewpoints (the first and second standard deviations). Use fringe theories or extreme case studies (the outliers) sparingly, introducing them only to define the limits or boundaries of your main thesis.
See also: What Is On-Chain Analysis?
2. What are the most common logical fallacies to avoid in an academic paper?
The two most common structural errors are affirming the consequent (assuming that because the conclusion is true, the premises must be true) and denying the antecedent (claiming that if the premise is false, the conclusion is automatically false). In qualitative writing, these errors often appear as circular reasoning or confusing correlation with causation.
3. Why is using formal mathematical notation helpful in an interdisciplinary paper?
Using precise mathematical notation, such as LaTeX equations, clearly defines the exact parameters of your data. It replaces vague language with measurable variables, demonstrating technical accuracy and raising the academic authority of your research paper.
4. How do I balance quantitative data with narrative prose without making my essay unreadable?
The key is to follow every piece of quantitative data with an explicit, deductive explanation of its meaning. Never let a statistic or equation stand alone. Use your paragraph transitions to explain exactly how the data matches your premise and how it supports your overall thesis.
Author Bio
Marcus Vance is a Senior Academic Content Strategist at MyAssignmentHelp, specializing in developing data-driven writing curricula for students across the United States. Holding a master’s degree in Mathematical Logic from Boston College, Marcus focuses on breaking down the traditional barriers between quantitative analysis and classical rhetoric to help students build clearer, more persuasive research papers.